Style combination · Contrasts
Instagram Slideshow Activism × Newsroom Data Graphics
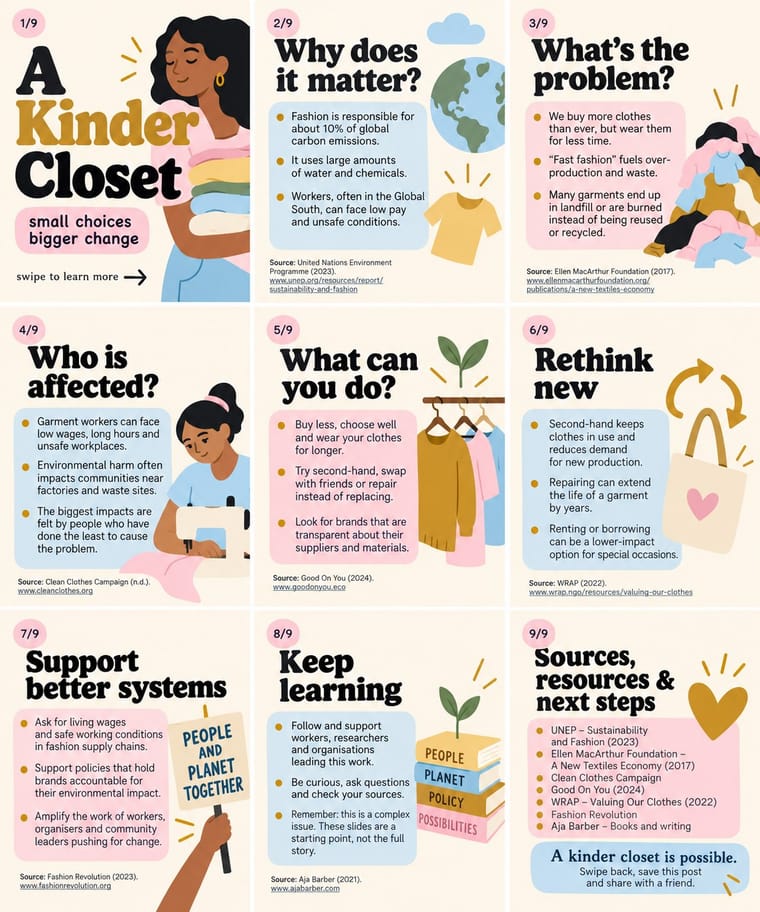
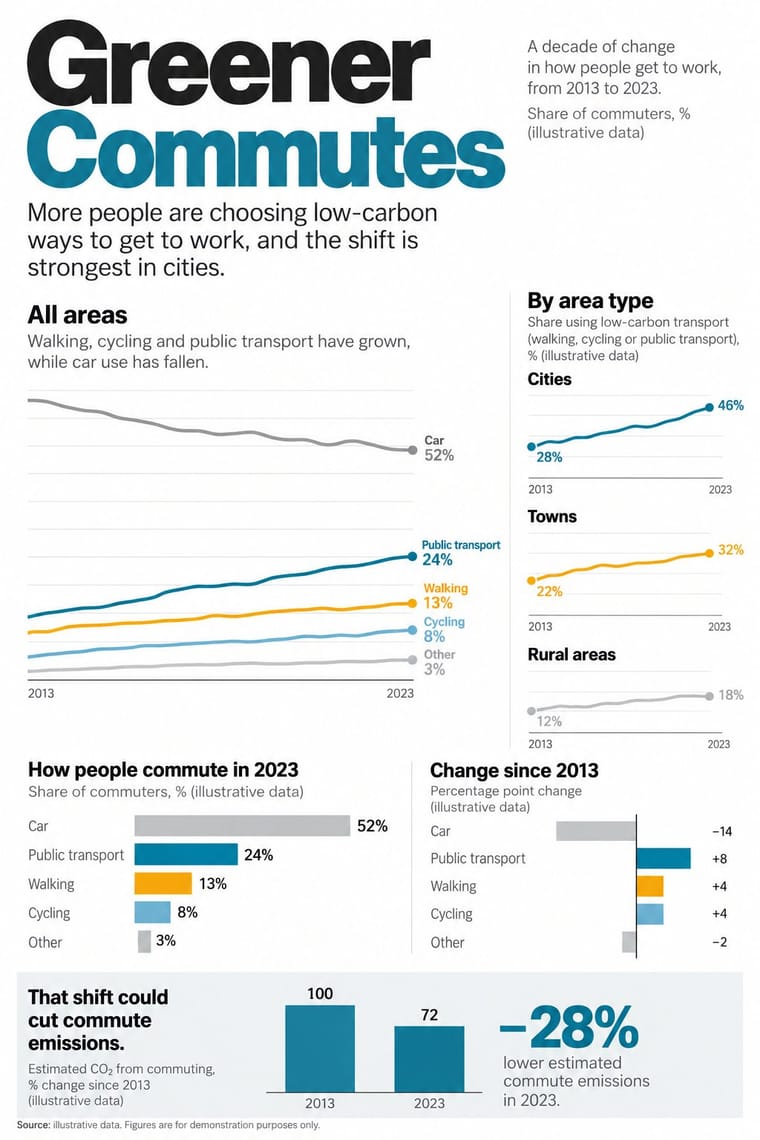
Sourced charts with a stated finding are the next step from a slide of bare bullet-point claims; the source line on every slide is common ground, since @soyouwanttotalkabout's maker said hers stood out for 'including sources at the bottom of every slide'.
Mix them and make something Instagram Slideshow Activism Newsroom Data Graphics
01
What each style brings
Each part of the design comes from the style with the stronger say in it, and each style gives at least two.
Instagram Slideshow Activism (Social-Justice Infographics) Newsroom Data Graphics & Scrollytelling
- Type from Instagram Slideshow Activism
- Colour from Instagram Slideshow Activism
- Form from Newsroom Data Graphics
- Composition from Newsroom Data Graphics
- Surface from Instagram Slideshow Activism
02
The type
Open fonts standing in for each style’s own type, which is often hand-drawn or commercial.
Display · Instagram Slideshow Activism
Index
DM Serif Display; Instagram Slideshow Activism used Large display serifs on the title card and Ovo (Nicole Fally, Sorkin Type, 2011), a medium-contrast serif with soft serifs and old-style letter widths
Text · Newsroom Data Graphics
The house style of newspaper graphics desks since about 2009–2011 (the New York Times graphics desk, D3.js, the Guardian Datablog): conventional charts drawn from the data, on a white or pale paper ground with light grey gridlines and no axis titles, lines labelled directly in place of a legend where possible and short annotations saying what to look at. A flush-left title states the finding and a source line closes the chart; one highlight colour picks out the story against grey context. In long-form pieces the graphic stays pinned while the text scrolls past and steps it through its states.
Inter; Newsroom Data Graphics used Helvetica and Arial
03
The colours
The ground and leading colours come from Instagram Slideshow Activism, with a counter-accent from Newsroom Data Graphics. The ink reads on the ground at 4.5:1 or more.
Instagram Slideshow Activism (Social-Justice Infographics) Newsroom Data Graphics & Scrollytelling
-
#fdf6ecground · 36% -
#1e1e1eink · 14% -
#c9962caccent · 18% -
#faab18accent · 14% -
#b9d7eeaccent · 10% -
#1380a1accent · 8%
As CSS
:root {
  --ground: #fdf6ec;
  --ink: #1e1e1e;
  --accent-1: #c9962c;
  --accent-2: #faab18;
  --accent-3: #b9d7ee;
  --accent-4: #1380a1;
  --font-display: "DM Serif Display", serif;
  --font-text: "Inter", sans-serif;
}
Use it with care
Instagram Slideshow Activism (Social-Justice Infographics): The look grew out of the 2020 Black Lives Matter protests, and critics such as the sociologist Eve Ewing warned that slides flatten complex problems and summarise the work of often Black authors without credit: name and link every source, credit the people whose work you condense, and check claims before posting. Do not turn the names and faces of people killed by police into decorative or shareable motifs; Vox quotes a warning that the look can 'commodify tragedy and obfuscate revolutionary messages' and notes that Breonna Taylor's death 'devolved into a meme'. Do not dress brand marketing in the look to perform allyship without action, and remember that its friendly packaging works for any message, including an army's messaging in an armed conflict (the IDF slideshow of May 2021) and misinformation, which text inside images makes hard to moderate. Write the slide text into the caption or alt text so screen-reader users can follow it.
Newsroom Data Graphics & Scrollytelling: The look signals checked, sourced reporting: never use it to present invented, unsourced or AI-generated figures as data, always name the source, and do not copy a newspaper's proprietary typefaces, masthead or logo. Give every chart a text summary and do not let colour alone carry the meaning, for readers who use screen readers or cannot tell the highlight colours apart. In a mock-up or generated image the figures are invented: label them plainly as illustrative (for example 'Source: illustrative data'), and never attribute them to a real newspaper, agency, survey or person.
04
The two styles
05
More combinations
With Instagram Slideshow Activism
- ACT UP & Gran Fury AIDS Activist Graphics Contrasts · Its confrontational opposite: black grounds, hot pink and one blunt slogan, where the typical slideshow shuns 'blood red or black messaging' (Ría Thompson-Washington) and softens the message to stay comfortable.
- Internet Ugly & Meme Vernacular Contrasts · The meme vernacular is its ironic other and the language of its parodies: crude, found and knowing where the slideshow is polished and sincere.
- Punk & DIY Zine Pairs well · The New York Times called swipe-through guides the new zines; borrow cut-and-paste collage and hand lettering to break the template sameness and look made by a person, not a kit.
- Isotype Pictorial Statistics Pairs well · Turn a slide of bullet-point statistics into rows of counted pictograms so the numbers are shown, not just asserted, without losing the friendly flat look.
- Latin American Feminist Protest Graphics (Ni Una Menos and the Green Wave) Contrasts · The hashtags #NiUnaMenos and #VivasNosQueremos also travelled on Facebook and Instagram, but their images point to a march, a wall or a scarf, whereas the slideshow lives and ends in the carousel in pastel templates.
With Newsroom Data Graphics
- Dark Tech Minimalism Contrasts · The dark dashboard shows unannotated metrics in tiles for people who already know what to look for; the newsroom chart sits on white and tells a general reader in words what the data shows. Add a finding title and one annotation when a dashboard has to explain itself.
- Isotype Pictorial Statistics Pairs well · When the count is of people, swap the bar for an Isotype row of repeated figures and keep the newsroom's flush-left finding title, annotations and source line.
- International Typographic Style Pairs well · Swiss flush-left grotesque setting on a strict grid carries the chart style into print editions, posters and reports while keeping the same rational voice.
- GOV.UK Design (GDS Style) Pairs well · Both are plain public-information web design on a white column with colours that each have one job; set the charts inside GOV.UK-style plain-text pages for public data releases.
- Data Humanism Contrasts · Newsroom graphics use chart types readers already know, labelled directly so they can be read at a glance; data humanism invents a new hand-drawn code for each dataset and asks for slow reading. Use the newsroom chart for the finding, a hand-drawn data portrait for the people behind it.
- Legible City Wayfinding (Heads-Up Pedestrian Maps) Pairs well · Add the annotated locator maps of data journalism to explain a neighbourhood with the same heads-up clarity.
- Sketchnoting and Graphic Recording Contrasts · Drawn live from speech rather than constructed from data; the pairing makes a plain summary more personal.