Style combination · Contrasts
Dark Tech Minimalism × Newsroom Data Graphics
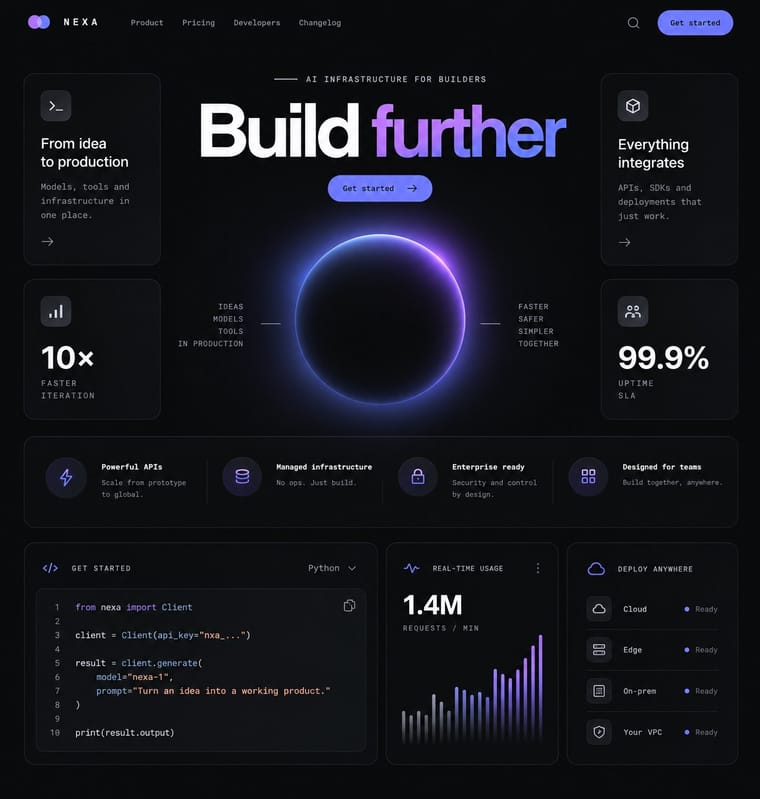
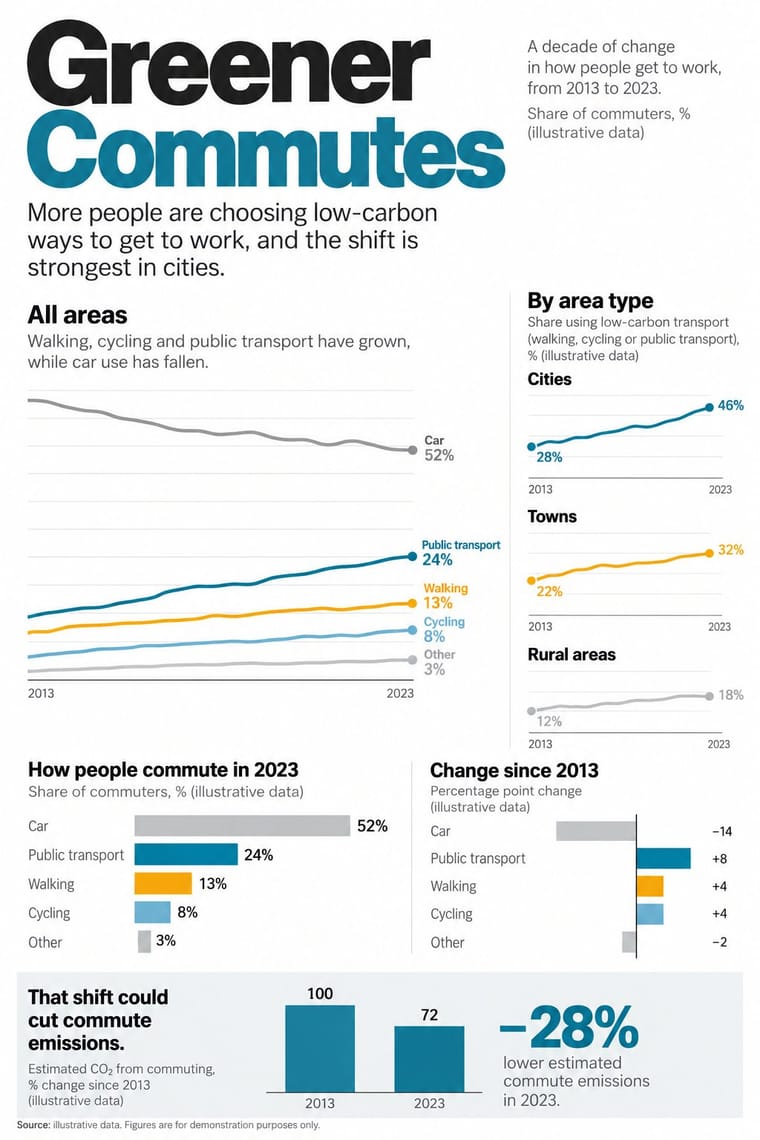
The dark dashboard shows unannotated metrics in tiles for people who already know what to look for; the newsroom chart sits on white and tells a general reader in words what the data shows. Add a finding title and one annotation when a dashboard has to explain itself.
Mix them and make something Dark Tech Minimalism Newsroom Data Graphics
01
What each style brings
Each part of the design comes from the style with the stronger say in it, and each style gives at least two.
Dark Tech Minimalism Newsroom Data Graphics & Scrollytelling
- Type from Dark Tech Minimalism
- Colour from Newsroom Data Graphics
- Form from Newsroom Data Graphics
- Composition from Dark Tech Minimalism
- Surface from Dark Tech Minimalism
02
The type
Open fonts standing in for each style’s own type, which is often hand-drawn or commercial.
Text · Dark Tech Minimalism
The dark, restrained aesthetic of developer tools and SaaS landing pages since about 2019: near-black grounds, grey type ramps, a neutral grotesque such as Inter, hairline borders, soft radial glows and bento grids of crisp product screenshots. Informally named after Linear's website and shared by Vercel, Raycast and many imitators, it borrows the look of code editors to signal precision and premium engineering.
Inter; Dark Tech Minimalism used Inter and Geist
03
The colours
The ground and leading colours come from Newsroom Data Graphics, with a counter-accent from Dark Tech Minimalism. The ink reads on the ground at 4.5:1 or more.
Dark Tech Minimalism Newsroom Data Graphics & Scrollytelling
-
#ffffffground · 36% -
#222222ink · 14% -
#faab18accent · 18% -
#a855f7accent · 14% -
#1380a1accent · 10% -
#5e6ad2accent · 8%
As CSS
:root {
  --ground: #ffffff;
  --ink: #222222;
  --accent-1: #faab18;
  --accent-2: #a855f7;
  --accent-3: #1380a1;
  --accent-4: #5e6ad2;
  --font-display: "Inter", sans-serif;
  --font-text: "Inter", sans-serif;
}
Use it with care
Newsroom Data Graphics & Scrollytelling: The look signals checked, sourced reporting: never use it to present invented, unsourced or AI-generated figures as data, always name the source, and do not copy a newspaper's proprietary typefaces, masthead or logo. Give every chart a text summary and do not let colour alone carry the meaning, for readers who use screen readers or cannot tell the highlight colours apart. In a mock-up or generated image the figures are invented: label them plainly as illustrative (for example 'Source: illustrative data'), and never attribute them to a real newspaper, agency, survey or person.
04
The two styles
05
More combinations
With Dark Tech Minimalism
- Generative & Dynamic Identities Pairs well · Run a generative shader or particle field behind the hero to replace stock imagery with live, on-brand texture.
- Corporate Memphis Contrasts · Dark tech minimalism displaced Corporate Memphis on SaaS sites; reintroduce one illustration only if the page genuinely lacks warmth.
- Neo-Brutalism Contrasts · A section of bright, outlined neo-brutalist boxes can break a monotonous dark page or signal an indie side project.
- Neo-Swiss Revival Pairs well · Borrow neo-Swiss grids and big, tightly tracked grotesque headlines to give dark product pages editorial structure.
- Glassmorphism Pairs well · On near-black grounds, a single glass pane with a 1px light border and a soft glow adds depth without clutter.
- Bento Feature-Grid Design Pairs well · Set the tiles on a near-black ground with hairline borders to get the dark SaaS variant of the same mosaic.
- Rave & Acid House Graphics Contrasts · Both live on black, but one whispers and one shouts; borrow a single neon gradient to wake up a restrained dark interface.
- Synthwave / Outrun Contrasts · Both live on dark grounds, but dark tech minimalism keeps gradients faint and drops nostalgia and ornament; switch to it when the neon sunset would shout over the content.
With Newsroom Data Graphics
- Isotype Pictorial Statistics Pairs well · When the count is of people, swap the bar for an Isotype row of repeated figures and keep the newsroom's flush-left finding title, annotations and source line.
- International Typographic Style Pairs well · Swiss flush-left grotesque setting on a strict grid carries the chart style into print editions, posters and reports while keeping the same rational voice.
- GOV.UK Design (GDS Style) Pairs well · Both are plain public-information web design on a white column with colours that each have one job; set the charts inside GOV.UK-style plain-text pages for public data releases.
- Data Humanism Contrasts · Newsroom graphics use chart types readers already know, labelled directly so they can be read at a glance; data humanism invents a new hand-drawn code for each dataset and asks for slow reading. Use the newsroom chart for the finding, a hand-drawn data portrait for the people behind it.
- Legible City Wayfinding (Heads-Up Pedestrian Maps) Pairs well · Add the annotated locator maps of data journalism to explain a neighbourhood with the same heads-up clarity.
- Instagram Slideshow Activism (Social-Justice Infographics) Contrasts · Sourced charts with a stated finding are the next step from a slide of bare bullet-point claims; the source line on every slide is common ground, since @soyouwanttotalkabout's maker said hers stood out for 'including sources at the bottom of every slide'.
- Sketchnoting and Graphic Recording Contrasts · Drawn live from speech rather than constructed from data; the pairing makes a plain summary more personal.