Style combination · Pairs well
Instagram Slideshow Activism × Isotype Pictorial Statistics
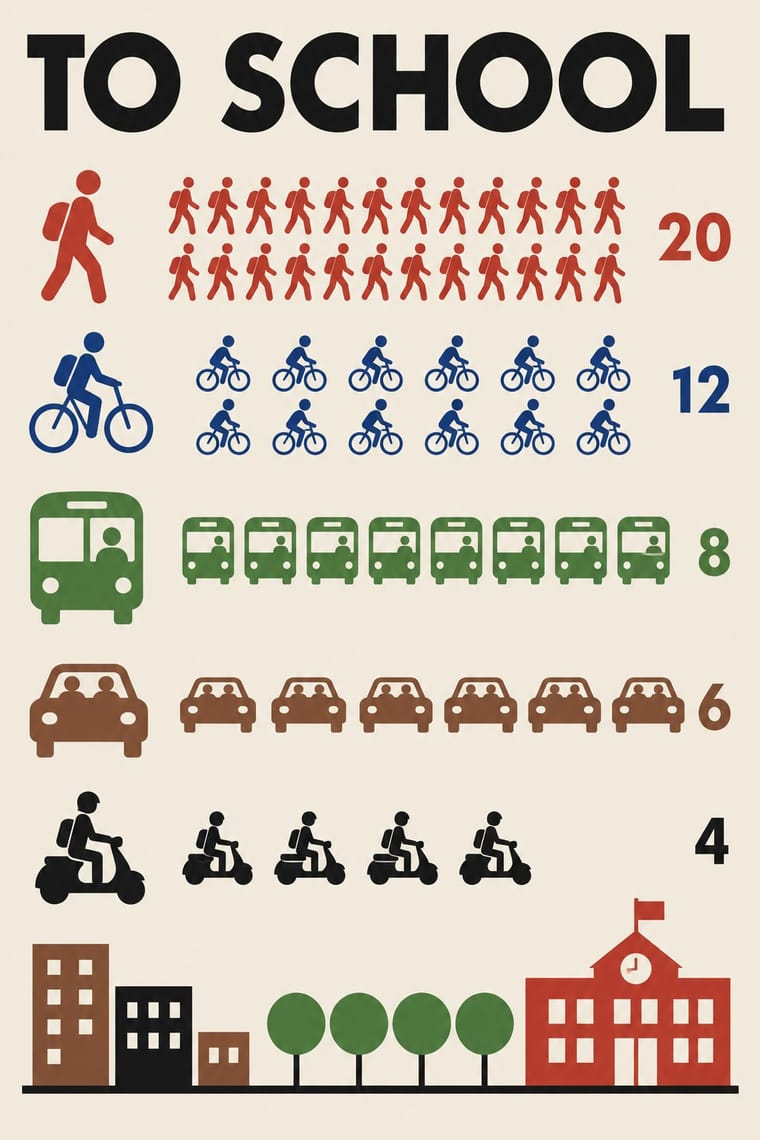
Turn a slide of bullet-point statistics into rows of counted pictograms so the numbers are shown, not just asserted, without losing the friendly flat look.
Mix them and make something Instagram Slideshow Activism Isotype Pictorial Statistics
01
What each style brings
Each part of the design comes from the style with the stronger say in it, and each style gives at least two.
Instagram Slideshow Activism (Social-Justice Infographics) Isotype Pictorial Statistics
- Type from Instagram Slideshow Activism
- Colour from Instagram Slideshow Activism
- Form from Isotype Pictorial Statistics
- Composition from Instagram Slideshow Activism
- Surface from Isotype Pictorial Statistics
02
The type
Open fonts standing in for each style’s own type, which is often hand-drawn or commercial.
Display · Instagram Slideshow Activism
Together
DM Serif Display; Instagram Slideshow Activism used Large display serifs on the title card and Ovo (Nicole Fally, Sorkin Type, 2011), a medium-contrast serif with soft serifs and old-style letter widths
Text · Isotype Pictorial Statistics
A method of visual education developed by Otto Neurath, Marie Neurath (Reidemeister) and Gerd Arntz in Red Vienna from 1925, which turns statistics into rows of identical pictograms where a greater quantity is shown by more signs, never by bigger ones. Continued in The Hague and Oxford until 1971, its standardised symbols, flat colours and sans-serif captions laid the foundations of modern information graphics and pictogram systems.
Jost; Isotype Pictorial Statistics used Futura and Gerd Arntz's linocut pictogram set (c. 4,000 signs), used like a fount of picture-type
03
The colours
The ground and leading colours come from Instagram Slideshow Activism, with a counter-accent from Isotype Pictorial Statistics. The ink reads on the ground at 4.5:1 or more.
Instagram Slideshow Activism (Social-Justice Infographics) Isotype Pictorial Statistics
-
#fdf6ecground · 36% -
#1e1e1eink · 14% -
#c9962caccent · 18% -
#c8372daccent · 14% -
#b9d7eeaccent · 10% -
#2c5aa0accent · 8%
As CSS
:root {
  --ground: #fdf6ec;
  --ink: #1e1e1e;
  --accent-1: #c9962c;
  --accent-2: #c8372d;
  --accent-3: #b9d7ee;
  --accent-4: #2c5aa0;
  --font-display: "DM Serif Display", serif;
  --font-text: "Jost", sans-serif;
}
Use it with care
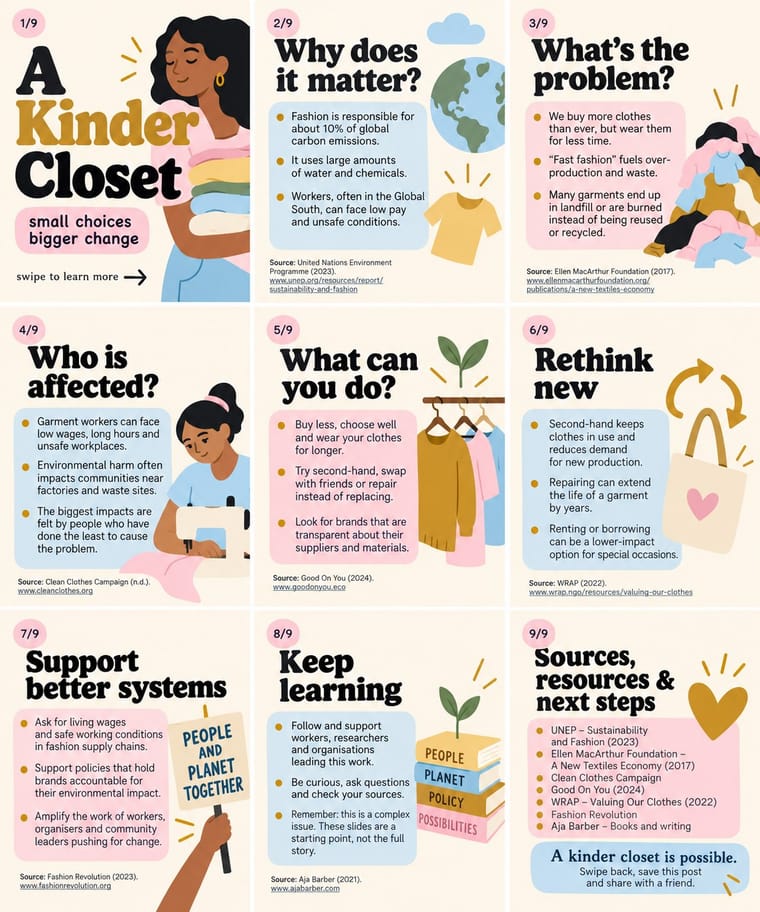
Instagram Slideshow Activism (Social-Justice Infographics): The look grew out of the 2020 Black Lives Matter protests, and critics such as the sociologist Eve Ewing warned that slides flatten complex problems and summarise the work of often Black authors without credit: name and link every source, credit the people whose work you condense, and check claims before posting. Do not turn the names and faces of people killed by police into decorative or shareable motifs; Vox quotes a warning that the look can 'commodify tragedy and obfuscate revolutionary messages' and notes that Breonna Taylor's death 'devolved into a meme'. Do not dress brand marketing in the look to perform allyship without action, and remember that its friendly packaging works for any message, including an army's messaging in an armed conflict (the IDF slideshow of May 2021) and misinformation, which text inside images makes hard to moderate. Write the slide text into the caption or alt text so screen-reader users can follow it.
04
The two styles
05
More combinations
With Instagram Slideshow Activism
- ACT UP & Gran Fury AIDS Activist Graphics Contrasts · Its confrontational opposite: black grounds, hot pink and one blunt slogan, where the typical slideshow shuns 'blood red or black messaging' (Ría Thompson-Washington) and softens the message to stay comfortable.
- Internet Ugly & Meme Vernacular Contrasts · The meme vernacular is its ironic other and the language of its parodies: crude, found and knowing where the slideshow is polished and sincere.
- Punk & DIY Zine Pairs well · The New York Times called swipe-through guides the new zines; borrow cut-and-paste collage and hand lettering to break the template sameness and look made by a person, not a kit.
- Newsroom Data Graphics & Scrollytelling Contrasts · Sourced charts with a stated finding are the next step from a slide of bare bullet-point claims; the source line on every slide is common ground, since @soyouwanttotalkabout's maker said hers stood out for 'including sources at the bottom of every slide'.
- Latin American Feminist Protest Graphics (Ni Una Menos and the Green Wave) Contrasts · The hashtags #NiUnaMenos and #VivasNosQueremos also travelled on Facebook and Instagram, but their images point to a march, a wall or a scarf, whereas the slideshow lives and ends in the carousel in pastel templates.
With Isotype Pictorial Statistics
- International Typographic Style Pairs well · Set Isotype rows of pictograms on a Swiss grid for public information that is rigorous yet friendly.
- Socialist Realist Propaganda Poster Contrasts · Socialist Realism dramatises with heroic figures while Isotype persuades by counting; choose evidence over emotion when trust matters.
- Flat Design Pairs well · Flat icon sets are Isotype's heirs; apply its one-symbol-one-meaning rule to keep an icon family consistent.
- Corporate Memphis Contrasts · Corporate Memphis uses flat figures for mood; Isotype's figures always count something, so use people icons only when they carry data.
- Ancient Egyptian Hieroglyphic & Register Composition Pairs well · Otto Neurath called his visual autobiography From hieroglyphics to Isotype, with chapters on hieroglyphics through the centuries and their renaissance; borrow the rule-bound sign family and rows of standing figures, but note the opposite rule of size: Isotype shows more by adding signs of equal size, Egypt shows rank by making one figure bigger.
- Data Humanism Contrasts · Isotype fixes one standard sign per thing and counts by repeating it so anyone can read the chart; data humanism invents a new code for each dataset and asks for slow reading. Choose Isotype for public information, data humanism for portraits of particular lives.
- Schematic Transit Diagram (Beck Tube Map Idiom) Pairs well · Add pictorial statistics beside the diagram to carry quantities as well as connections.
- Warli Painting Contrasts · Both build people from a few reduced shapes and repeat them in rows; Isotype's figures count data in flat colours on a light ground, Warli's narrate ritual and village life in white on earth, so borrow the repetition but not the meaning.