Style combination · Contrasts
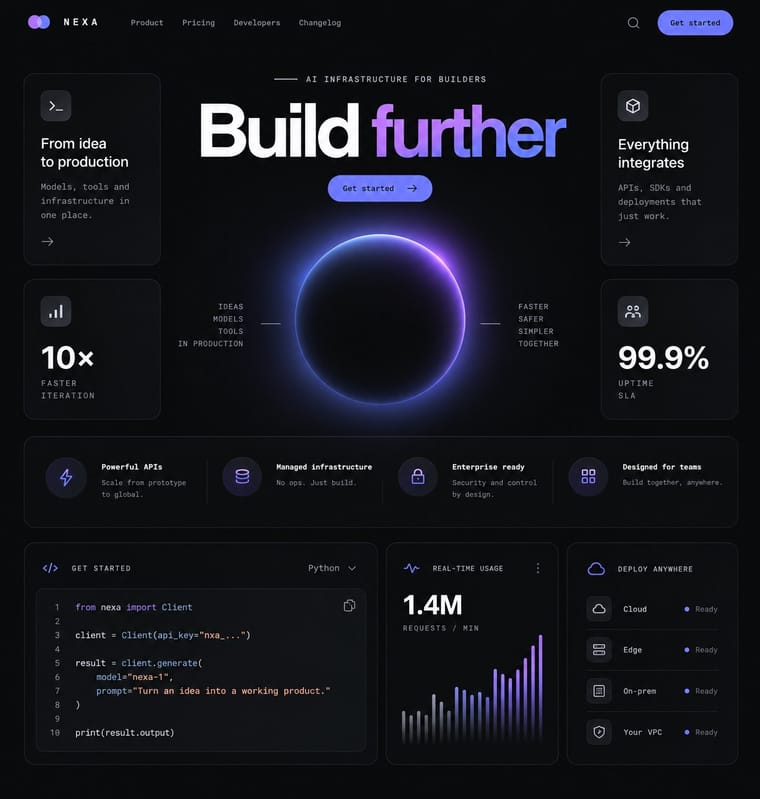
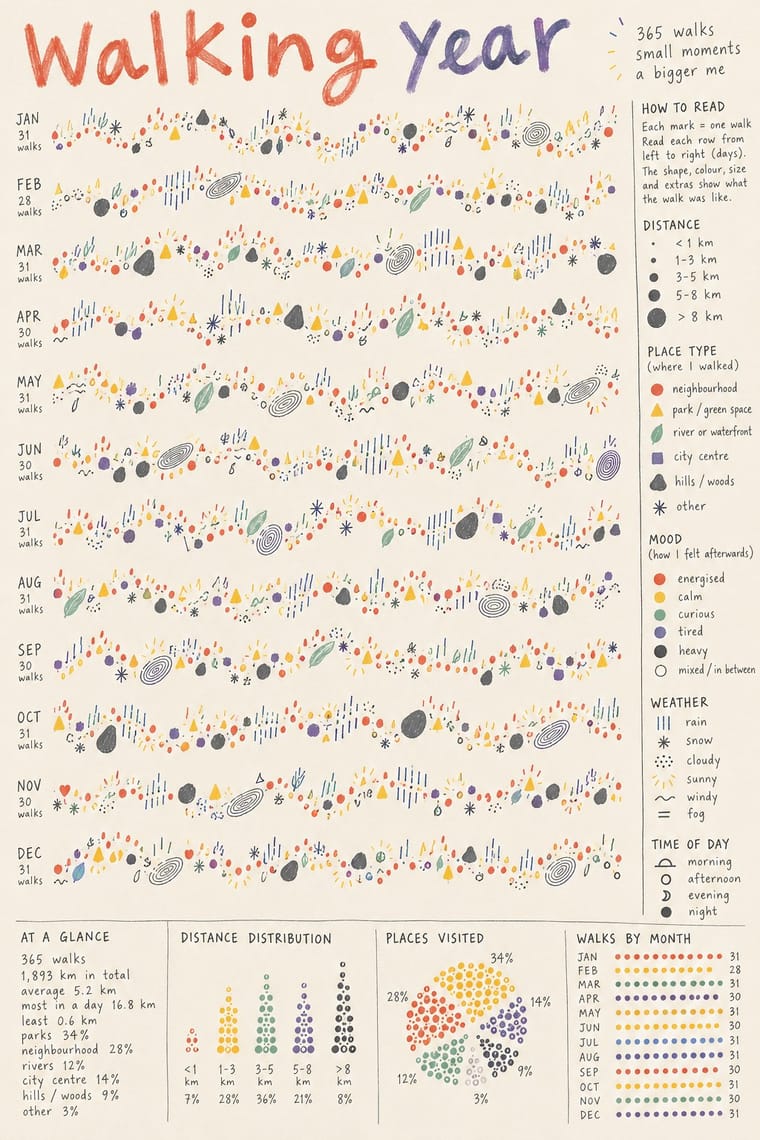
Dark Tech Minimalism × Data Humanism
The dark dashboard shows a few clean metrics at a glance; data humanism draws the messy, qualitative data a dashboard leaves out. Put one hand-drawn data portrait beside the KPIs to show the people behind the numbers.
Mix them and make something Dark Tech Minimalism Data Humanism
01
What each style brings
Each part of the design comes from the style with the stronger say in it, and each style gives at least two.
Dark Tech Minimalism Data Humanism
- Type from Dark Tech Minimalism
- Colour from Dark Tech Minimalism
-
Data Humanism avoids dark ground: this is where the two pull against each other, which is the point of the contrast.
- Form from Data Humanism
- Composition from Dark Tech Minimalism
-
Data Humanism avoids cards & bento tiles: this is where the two pull against each other, which is the point of the contrast.
- Surface from Data Humanism
02
The type
Open fonts standing in for each style’s own type, which is often hand-drawn or commercial.
Text · Data Humanism
An information-design approach that draws data rather than charting it, treating numbers as personal, approximate and human. Named by Giorgia Lupi in Print (2017) after Dear Data (2014–15), her year of weekly hand-drawn postcards with Stefanie Posavec, it invents a visual code for each dataset: many small hand-made marks whose shape, colour and orientation each encode a variable, decoded through a custom legend and handwritten notes. Dense and layered, it asks to be read slowly, against Isotype's standard signs and at-a-glance dashboards; Federica Fragapane carries it into vector work.
Caveat; Data Humanism used The designer's own handwriting in pen or pencil for titles, legends and annotations and Giorgia Lupi, a custom typeface made at Pentagram from Lupi's handwriting (2019), used in What Counts
03
The colours
The ground and leading colours come from Dark Tech Minimalism, with a counter-accent from Data Humanism. The ink reads on the ground at 4.5:1 or more.
Dark Tech Minimalism Data Humanism
-
#08090aground · 36% -
#f7f8f8ink · 14% -
#a855f7accent · 18% -
#f2c14eaccent · 14% -
#5e6ad2accent · 10% -
#e0574aaccent · 8%
As CSS
:root {
  --ground: #08090a;
  --ink: #f7f8f8;
  --accent-1: #a855f7;
  --accent-2: #f2c14e;
  --accent-3: #5e6ad2;
  --accent-4: #e0574a;
  --font-display: "Inter", sans-serif;
  --font-text: "Caveat", cursive;
}
Use it with care
Data Humanism: Data portraits are usually drawn from real people's lives (health, moods, relationships, locations): get consent and anonymise before publishing other people's personal data. Because the custom encodings cannot be read at a glance, give a plain-text summary and the key alongside the drawing for readers who use screen readers or are in a hurry.
04
The two styles
05
More combinations
With Dark Tech Minimalism
- Generative & Dynamic Identities Pairs well · Run a generative shader or particle field behind the hero to replace stock imagery with live, on-brand texture.
- Corporate Memphis Contrasts · Dark tech minimalism displaced Corporate Memphis on SaaS sites; reintroduce one illustration only if the page genuinely lacks warmth.
- Neo-Brutalism Contrasts · A section of bright, outlined neo-brutalist boxes can break a monotonous dark page or signal an indie side project.
- Neo-Swiss Revival Pairs well · Borrow neo-Swiss grids and big, tightly tracked grotesque headlines to give dark product pages editorial structure.
- Newsroom Data Graphics & Scrollytelling Contrasts · The dark dashboard shows unannotated metrics in tiles for people who already know what to look for; the newsroom chart sits on white and tells a general reader in words what the data shows. Add a finding title and one annotation when a dashboard has to explain itself.
- Glassmorphism Pairs well · On near-black grounds, a single glass pane with a 1px light border and a soft glow adds depth without clutter.
- Bento Feature-Grid Design Pairs well · Set the tiles on a near-black ground with hairline borders to get the dark SaaS variant of the same mosaic.
- Rave & Acid House Graphics Contrasts · Both live on black, but one whispers and one shouts; borrow a single neon gradient to wake up a restrained dark interface.
With Data Humanism
- Isotype Pictorial Statistics Contrasts · Isotype fixes one standard sign per thing and counts by repeating it so anyone can read the chart; data humanism invents a new code for each dataset and asks for slow reading. Choose Isotype for public information, data humanism for portraits of particular lives.
- Corporate Memphis Contrasts · Both aim to feel warm and human, but Corporate Memphis draws generic faceless figures for mood, while data humanism draws the specific data of specific people. Replace stock warmth with a drawing of real data when a brand needs sincerity.
- Generative & Dynamic Identities Pairs well · Let a generative system draw personal data portraits from people's own answers, as What Counts did, but give the code a hand-drawn grammar and a legend so the output reads as made by people.
- Risograph & Indie Print Culture Pairs well · Print hand-drawn data drawings in two or three riso spot inks for zines and postcards, so each ink becomes one data category and the grain matches the hand.
- Biobrand (Organic Biotech CGI) Contrasts · Data humanism draws organic forms by hand to encode real observations; the biobrand renders them as promotional objects. Borrow its honest encoding when a render risks overclaiming.
- Sketchnoting and Graphic Recording Pairs well · Both keep the human hand visible in explanatory drawing; sketchnoting adds live speed and containers.
- Newsroom Data Graphics & Scrollytelling Contrasts · Newsroom graphics use chart types readers already know, labelled directly so they can be read at a glance; data humanism invents a new hand-drawn code for each dataset and asks for slow reading. Use the newsroom chart for the finding, a hand-drawn data portrait for the people behind it.
- Mithila (Madhubani) Painting Pairs well · Both treat hand-drawn hatching, dots and repeated small marks as content; a kachni-style legend or border can give a hand-drawn chart a South Asian line vocabulary, provided a Mithila painter is commissioned for it.