Style combination · Contrasts
Isotype Pictorial Statistics × Legible City Wayfinding
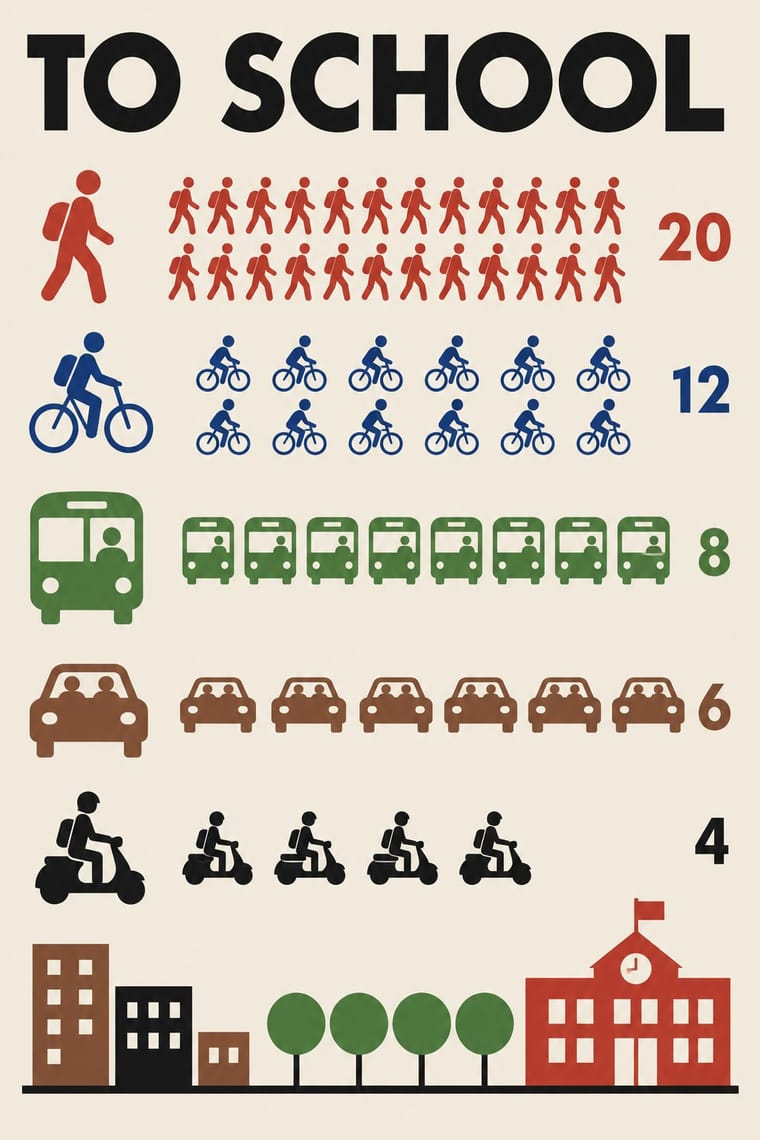
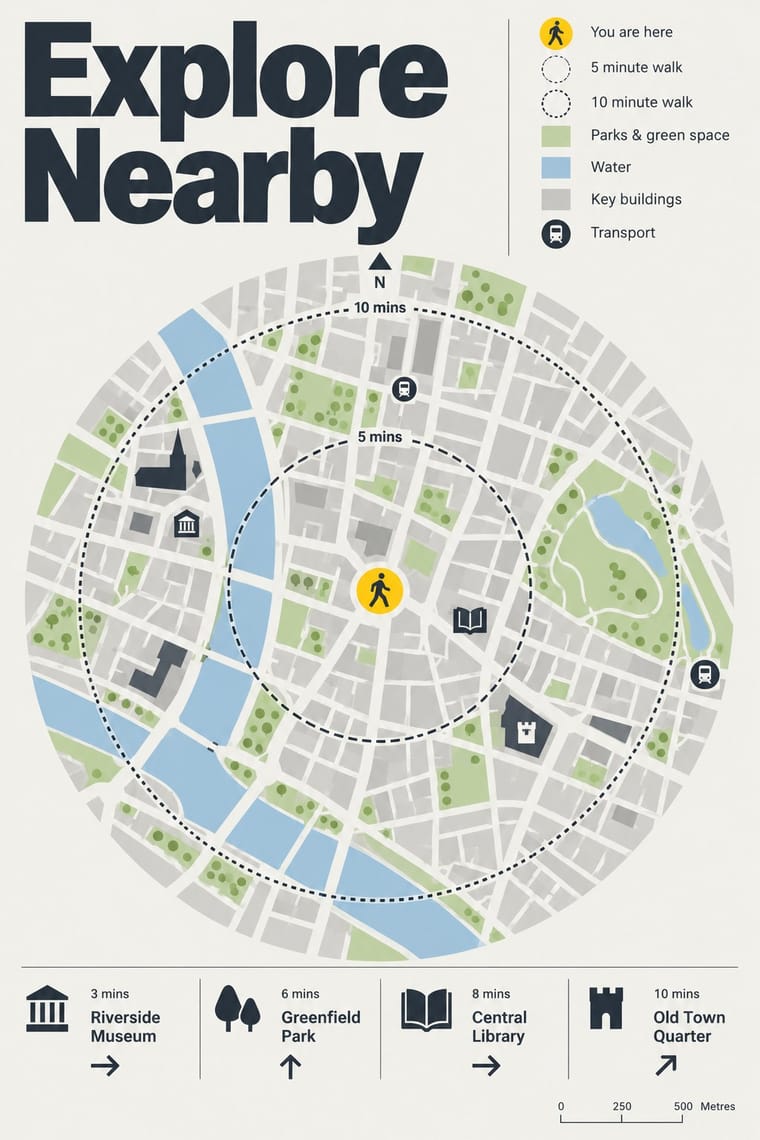
Both turn information into friendly pictures, but Isotype counts identical pictograms in rows while these maps draw particular buildings in their place.
Mix them and make something Isotype Pictorial Statistics Legible City Wayfinding
01
What each style brings
Each part of the design comes from the style with the stronger say in it, and each style gives at least two.
Isotype Pictorial Statistics Legible City Wayfinding (Heads-Up Pedestrian Maps)
- Type from Legible City Wayfinding
- Colour from Legible City Wayfinding
- Form from Isotype Pictorial Statistics
- Composition from Isotype Pictorial Statistics
- Surface from Isotype Pictorial Statistics
02
The type
Open fonts standing in for each style’s own type, which is often hand-drawn or commercial.
Display · Legible City Wayfinding
Grid
Fira Sans, standing in for New Johnston, Transport for London's corporate humanist sans, used by AIG as Legible London's identifying font on its vitreous enamel and steel signs
Text · Isotype Pictorial Statistics
A method of visual education developed by Otto Neurath, Marie Neurath (Reidemeister) and Gerd Arntz in Red Vienna from 1925, which turns statistics into rows of identical pictograms where a greater quantity is shown by more signs, never by bigger ones. Continued in The Hague and Oxford until 1971, its standardised symbols, flat colours and sans-serif captions laid the foundations of modern information graphics and pictogram systems.
Jost; Isotype Pictorial Statistics used Futura and Gerd Arntz's linocut pictogram set (c. 4,000 signs), used like a fount of picture-type
03
The colours
The ground and leading colours come from Legible City Wayfinding, with a counter-accent from Isotype Pictorial Statistics. The ink reads on the ground at 4.5:1 or more.
Isotype Pictorial Statistics Legible City Wayfinding (Heads-Up Pedestrian Maps)
-
#f2f1ecground · 36% -
#2b3640ink · 14% -
#ffd100accent · 18% -
#c8372daccent · 14% -
#a9c8deaccent · 10% -
#2c5aa0accent · 8%
As CSS
:root {
  --ground: #f2f1ec;
  --ink: #2b3640;
  --accent-1: #ffd100;
  --accent-2: #c8372d;
  --accent-3: #a9c8de;
  --accent-4: #2c5aa0;
  --font-display: "Fira Sans", sans-serif;
  --font-text: "Jost", sans-serif;
}
04
The two styles
05
More combinations
With Isotype Pictorial Statistics
- International Typographic Style Pairs well · Set Isotype rows of pictograms on a Swiss grid for public information that is rigorous yet friendly.
- Socialist Realist Propaganda Poster Contrasts · Socialist Realism dramatises with heroic figures while Isotype persuades by counting; choose evidence over emotion when trust matters.
- Flat Design Pairs well · Flat icon sets are Isotype's heirs; apply its one-symbol-one-meaning rule to keep an icon family consistent.
- Corporate Memphis Contrasts · Corporate Memphis uses flat figures for mood; Isotype's figures always count something, so use people icons only when they carry data.
- Ancient Egyptian Hieroglyphic & Register Composition Pairs well · Otto Neurath called his visual autobiography From hieroglyphics to Isotype, with chapters on hieroglyphics through the centuries and their renaissance; borrow the rule-bound sign family and rows of standing figures, but note the opposite rule of size: Isotype shows more by adding signs of equal size, Egypt shows rank by making one figure bigger.
- Data Humanism Contrasts · Isotype fixes one standard sign per thing and counts by repeating it so anyone can read the chart; data humanism invents a new code for each dataset and asks for slow reading. Choose Isotype for public information, data humanism for portraits of particular lives.
- Schematic Transit Diagram (Beck Tube Map Idiom) Pairs well · Add pictorial statistics beside the diagram to carry quantities as well as connections.
- Warli Painting Contrasts · Both build people from a few reduced shapes and repeat them in rows; Isotype's figures count data in flat colours on a light ground, Warli's narrate ritual and village life in white on earth, so borrow the repetition but not the meaning.
With Legible City Wayfinding
- London Transport Design Pairs well · The parent: Legible London is a TfL system in TfL's New Johnston that extends the Underground's single-system idea from stations to the streets between them; borrow the discipline of one family repeated everywhere.
- British Road Signage (Kinneir & Calvert) Contrasts · An influence from the same British public-information lineage, but road signs give drivers arrows and place names read at speed, while these totems give walkers a map to stand and read.
- GOV.UK Design (GDS Style) Pairs well · Civic, research-led and plain-spoken; pair the street maps with GOV.UK's plain screens for a public service that reads the same on the pavement and the phone.
- Newsroom Data Graphics & Scrollytelling Pairs well · Add the annotated locator maps of data journalism to explain a neighbourhood with the same heads-up clarity.
- Schematic Transit Diagram (Beck Tube Map Idiom) Pairs well · Pair the schematic network with heads-up street maps so users can move from topology to true geography.